Graphing Live Data
module load graph
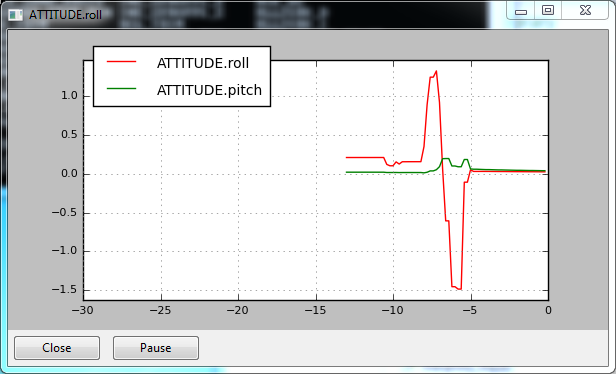
A module to plot (graph) data in realtime from the UAV. It is useful for looking for time-varying patterns in the data
After loading, new plots can be created by:
graph dataname
Multiple items can be added at once. Use the :2 to specify using the
right vertical axis.
graph VFR_HUD.alt VFR_HUD.airspeed:2
Arbitrary mathematical functions can also be used.
graph "(VFR_HUD.alt/1000.0)+5"
Additionally, the timespan and tick resolution of the graph window can
be changed. Use graph timespan X to change the timespace to X
seconds and graph tickresolution Y to change the tick resolution to
Y seconds.
There are two global settings for graphs: timespan and tickresolution.
To set the timespan along the horizontal axis (in seconds):
graph timespan 20
To set the tickresolution along the horizontal axis (1/<number of ticks>):
graph timespan 0.2
To graph a NAMED_VALUE_FLOAT value that has a name``NAME``, which can be used for freeform data:
graph NAMED_VALUE_FLOAT[NAME].value