Debugging with GDB on STM32
This page describes how to setup GDB on Linux to debug issues on STM32. The specific commands were tested on Ubuntu 18.10.
Introduction
GDB (the GNU Debugger) allows you to see what is going on inside another program while it executes or what another program was doing at the moment it crashed which can be useful when investigating very low-level failures with the STM32
This guide assumes that you have already successfully built the firmware on your machine following the instructions for Windows, Mac or Linux.
One the the following debuggers is required:
BlackMagic probe (available from 1 Bit Squared)
A small plug (FTSH-105-04-L-DV) may be required to solder on to the JTAG port of the flight controller.
Compiling the Firmware
Build and upload the debug variant of the firmware:
`
./waf configure --board=Pixhawk1-1M --debug --enable-asserts
./waf --target=examples/UART_test --upload
`
Connecting the BlackMagic probe to the Pixhawk
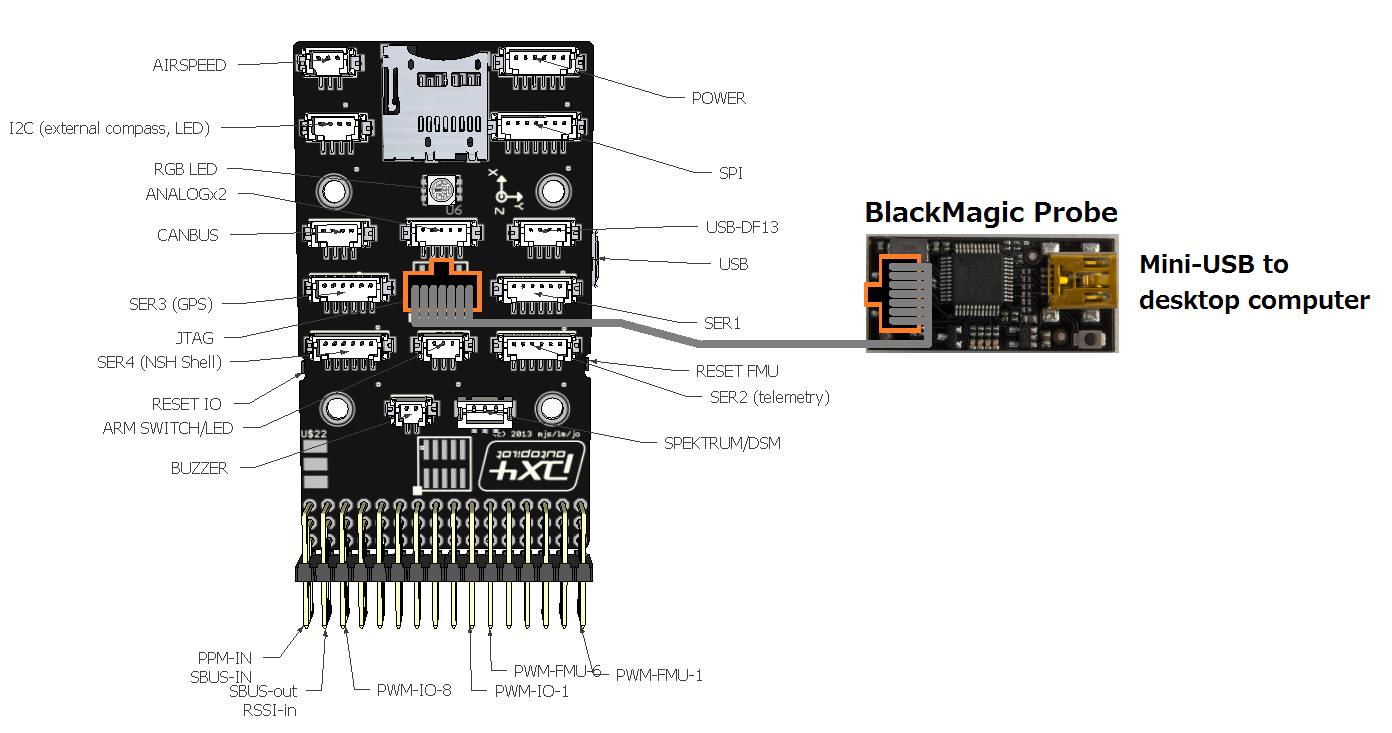
The BlackMagic probe should be connected to the Pixhawk’s JTAG connector using the grey 10wire cable that came with the probe. Note that most Pixhawk come with no headers soldered onto the JTAG connector because it interferes with the case.
Connecting the ST-Link V2 JTAG debugger to the STM32
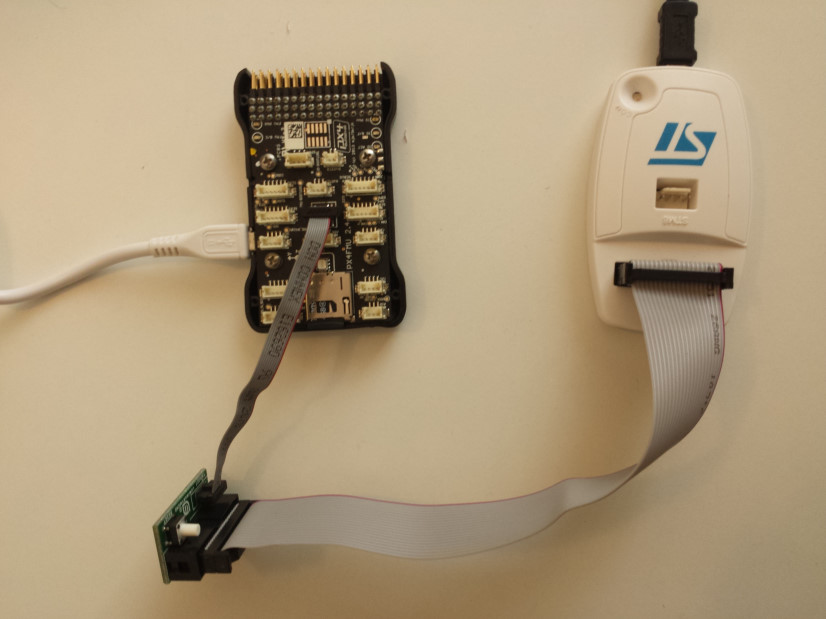
The ST-Link debugger should be connected to the STM32’s JTAG connector using the JTAG breakout cable. Connect the SWDIO and SWCLK (see Debug port pinout for reference) to the corresponding SWDIO and SWCLK pins on the ST-Link debugger.
Ensure BRD_OPTIONS sets the “Enable Debug Pins” bit if bit 3 is present in the vehicle software being used. It is also advised to disable the watchdog by ensuring bit 0 is not set.
Installing GDB
If using Ubuntu, GDB is likely already installed on your machine and it will likely work although we recommend using the version available for download here https://firmware.ardupilot.org/Tools/STM32-tools
The gcc-arm-none-eabi*-linux.tar.bz2 file contains both the recommended compiler and the recommended version of gdb.
If you will be using the ST-Link debugger, please install the gdb version found in the gcc-arm-none-eabi-6-2017-q2-update-linux.tar.bz2 file.
After installation you should find you have a tool called arm-none-eabi-gdb.
Installing OpenOCD
You will need to install OpenOCD if you are using the ST-Link debugger:
sudo apt-get install openocd.
Before OpenOCD and GDB are run, their configuration files need to be copied to the build folder. Note that the build folder name is the same at the board name.
Go to the ./Tools/debug folder and copy openocd.cfg to ./build/<boardname>/bin,
if not done so previously
Type openocd in your terminal in the bin directory above.
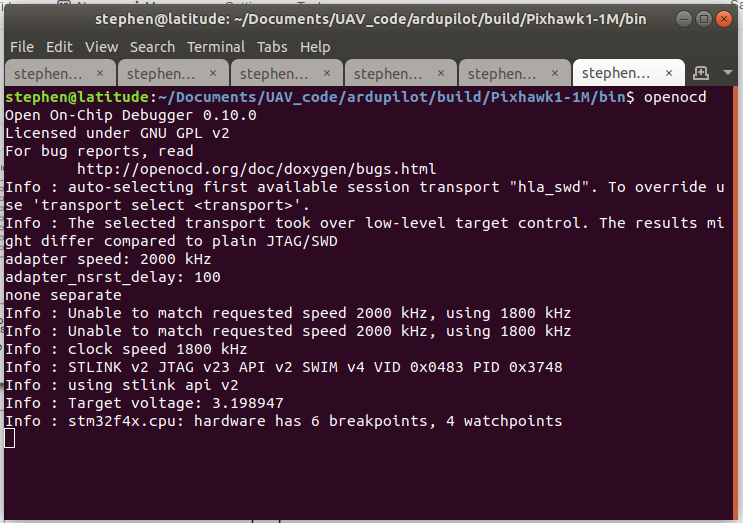
Note: there are 2 versions of the ST-link debugger on eBay, so if
the command does not work, change the first line to source [find interface/stlink-v2-1.cfg].
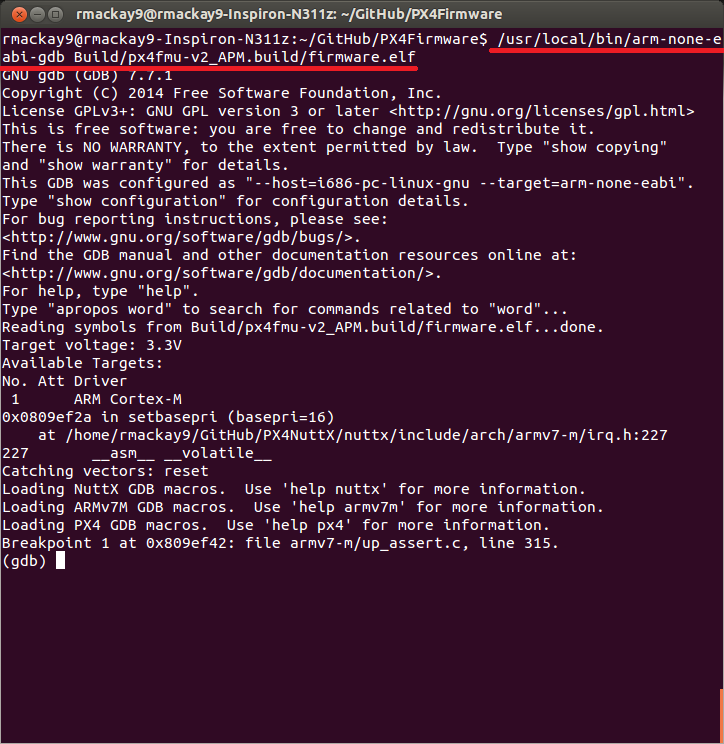
Starting GDB and running some commands
Copy .gdbinit to ./build/<boardname>/bin and
edit ~/.gdbinit to have the following text: set auto-load safe-path /,
if not done so previously.
In another window, type arm-none-eabi-gdb arducopter in the
./build/<boardname>/bin folder. Now you have
connected to the gdb debugging session and can use the commands from
the next section.
Some useful commands:
r – restarts the process
b function-name – i.e. b setup – sets a breakpoint at the start of
the “setup” function. Note a class name can be prepended such as
b AC_AttitudeControl::init
Note
If you are debugging a board using external flash and you receive “Failed to read memory at 0x…..”, try “set mem inaccessible-by-default off”
Ctrl-C – stops the code from executing so you can set breakpoints,
etc
continue – continues the code from wherever it was stopped
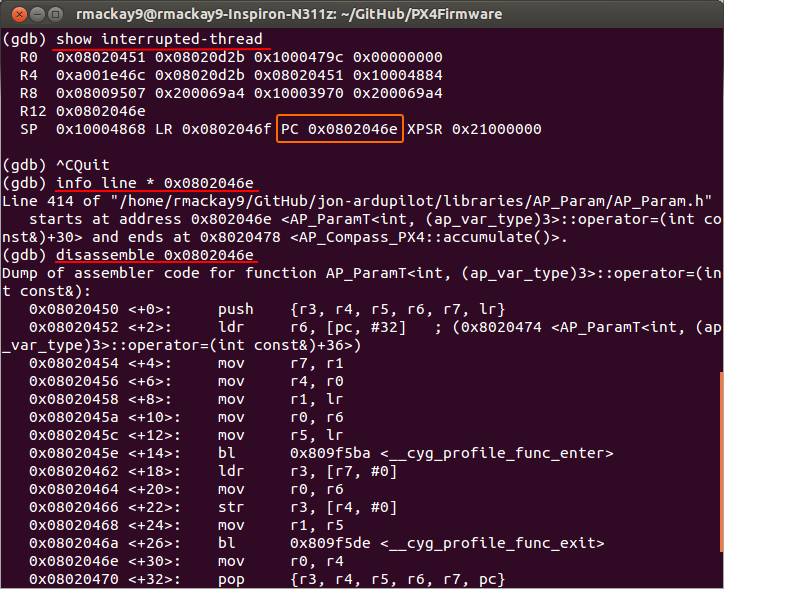
show interrupted-thread – shows address where execution has stopped
(see below)
info line * <address> – shows c++ line for a given address (i.e.
from show interrupted-thread)
info threads – show status of all threads
disassemble <address> – converts given address into assembler code
exit – exits from the GDB