Using Linux Trace Toolkit ng (LTTng) to Create Realtime ArduPilot Traces
This article explains how to use LTTng for creating runtime traces for ArduPilot running on Linux boards (only).
Overview
Tracing is a technique used to record the real-time behaviour of a software in memory and analyze the execution of the code off-line. It can be very useful to understand the interaction between threads, processes, the duration of certain events and the sequencing of some operations.
LTTng is a Linux tool that can be used to trace either a userspace application, or the Linux kernel itself. It produces trace files that can be analyzed later, mostly off-board. Lttng’s implementation in ArduPilot uses userspace tracing but you can at the same time monitor what’s going on inside the kernel, provided the kernel has tracepoints enabled (in its config).
LTTng has been integrated using the
Perf_Lttng
class, which handles 3 operations: Begin, End, Count. You
add tracing to your code by calling the performance utility methods in
Perf.cpp.
Monitoring APM with LTTng
In order to monitor ArduPilot with LTTng, the first thing to do is to install LTTng on your board. The LTTng documentation explains how to install it on your Linux distribution here. If there is no official package for your Linux distribution, you can also build it from the sources as explained here
Note
You can’t build statically with LTTng enabled because it calls dlopen. On bebop I had to build the whole system with armhf toolchain, which is not the one used by default.
Putting trace events inside the code
In order to trace ArduPilot, you call the following performance utility methods:
hal.util->perf_begin(my_perf);
hal.util->perf_end(my_perf);
Before calling these functions, my_perf needs to be allocated
AP_HAL::Util::perf_counter_t my_perf = hal.util->perf_alloc(AP_HAL::Util::PC_ELAPSED, "my_perf");
An example of adding multiple perf events can be seen in this patch.
Trace capture
Enable trace events in ArduPilot
Once you have the modified version of ArduPilot launched on your board and LTTng tools installed, you can check that ArduPilot LTTng events are available on your board’s console terminal using the following command:
lttng list --userspace
This should output a list of events including:
ardupilot:count (loglevel: TRACE_DEBUG_LINE (13)) (type: tracepoint)
ardupilot:end (loglevel: TRACE_DEBUG_LINE (13)) (type: tracepoint)
ardupilot:begin (loglevel: TRACE_DEBUG_LINE (13)) (type: tracepoint)
Tip
Refer to the LTTng documentation for information on how to list kernel events.
Capturing a trace session
A trace session can be started, stopped, re-started and destroyed.
Destroying a trace session doesn’t delete the traces from permanent storage but means that you have to restart a new session if you want to continue capturing.
Create session:
lttng create -o my_trace_directory
Enable ArduPilot events:
lttng enable-event --userspace ardupilot:count
lttng enable-event --userspace ardupilot:end
lttng enable-event --userspace ardupilot:begin
To enable kernel events, see these instructions.
Start capturing:
lttng start
To stop capturing:
lttng stop
If you have babeltrace installed on board, you can view the result in text:
lttng view
Restart or destroy your session:
lttng destroy
Analyzing the trace
In order to analyze your trace, first copy the trace directory you indicated at session creation to your computer.
Babeltrace
You can analyze the trace using babeltrace. This is a command line tool that is able to translate the trace into text format:
babeltrace my_trace_directory
The result is a series of events with the according timestamps and the number of the CPU they have been running on.
To go further with that, you can use babeltrace’s python bindings to write a python program analyzing the trace you have captured.
Trace compass
Trace compass is an Eclipse plugin that can read LTTng traces and display them in a UI that is adapted to some analyzes.
Lttng2lxt
Trace compass is very powerful but up to now, I haven’t been able to analyze userspace traces in a convenient way.
Lttng2lxt is an open source tool written by Ivan Djelic from Parrot. It is a very simple command line tool that generate waveforms readable by gtkwave. I have added support for ArduPilot events to lttng2lxt.
In order to use it, get the sources from my github repository:
git clone https://github.com/jberaud/lttng2lxt
You will have to install libbabeltrace-ctf-dev and libbabeltrace. On Debian or Ubuntu do this with the following command:
sudo apt-get install libbabeltrace-ctf-dev libbabeltrace
Compile it:
sudo make install
Use it to generate a gtkwave waveform file:
lttng2lxt my_trace_directory
This will produce a file called my_trace_directory.lxt.
Analyzing your trace using gtkwave
First install gtkwave. On Debian or Ubuntu you can do this with the command:
sudo apt-get install gtkwave
Then open your trace using gtkwave:
gtkwave -A my_trace_directory.lxt
Use the Zoom fit button 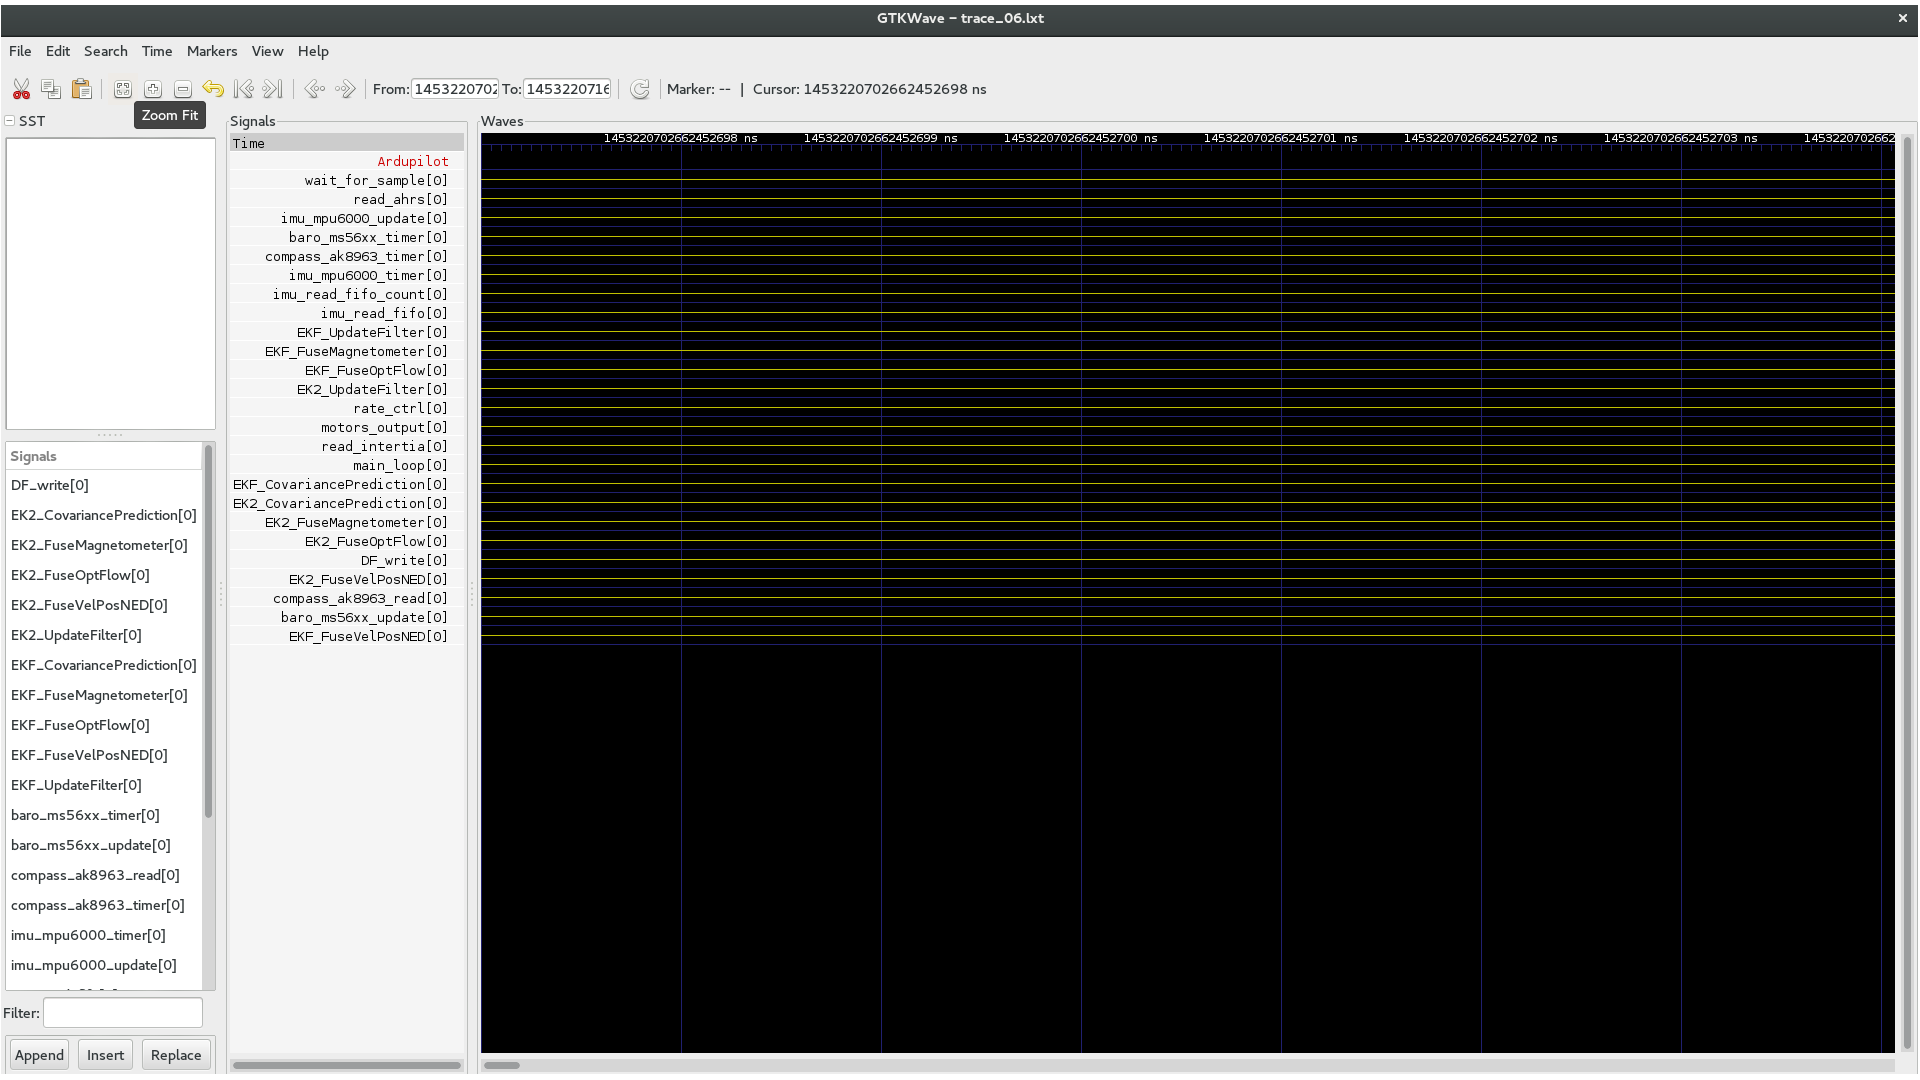 .
.
The result should look like this:
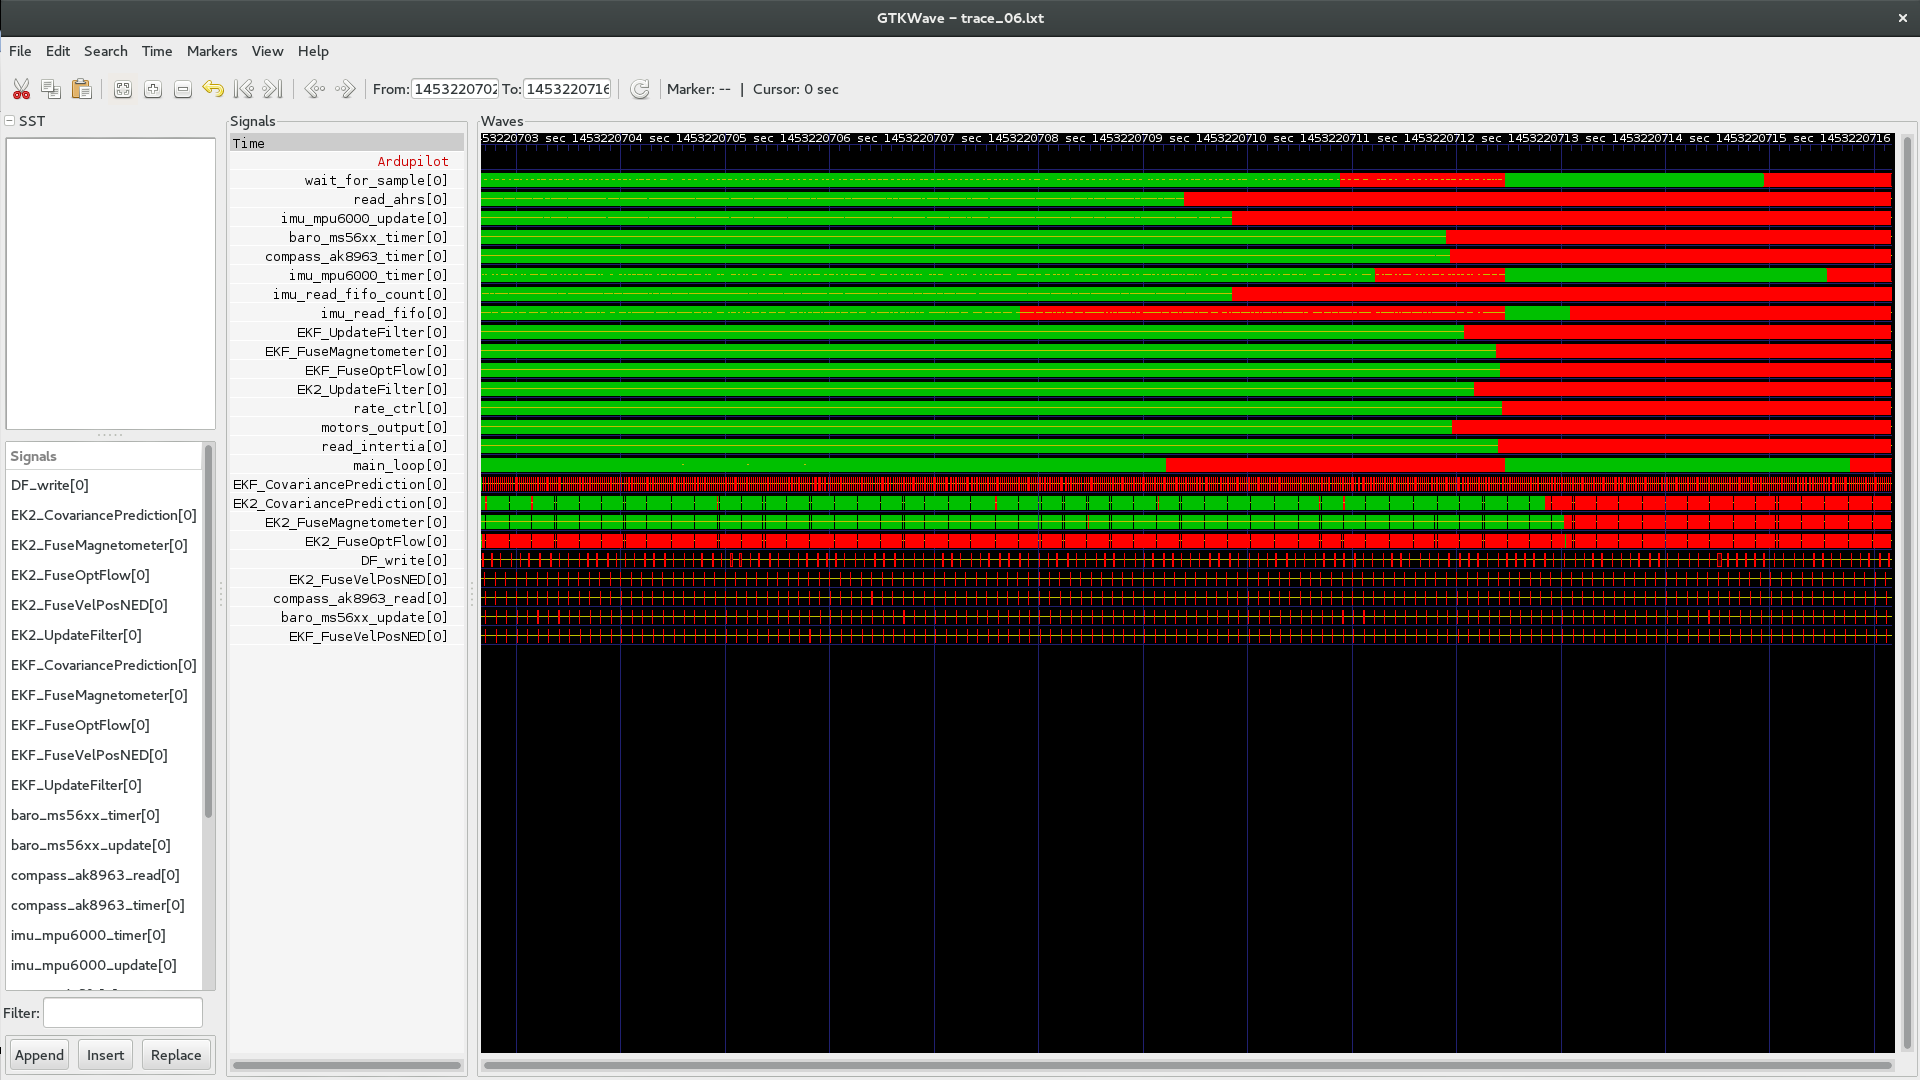
You can then zoom in or out and see the exact execution sequence, with the associated timings
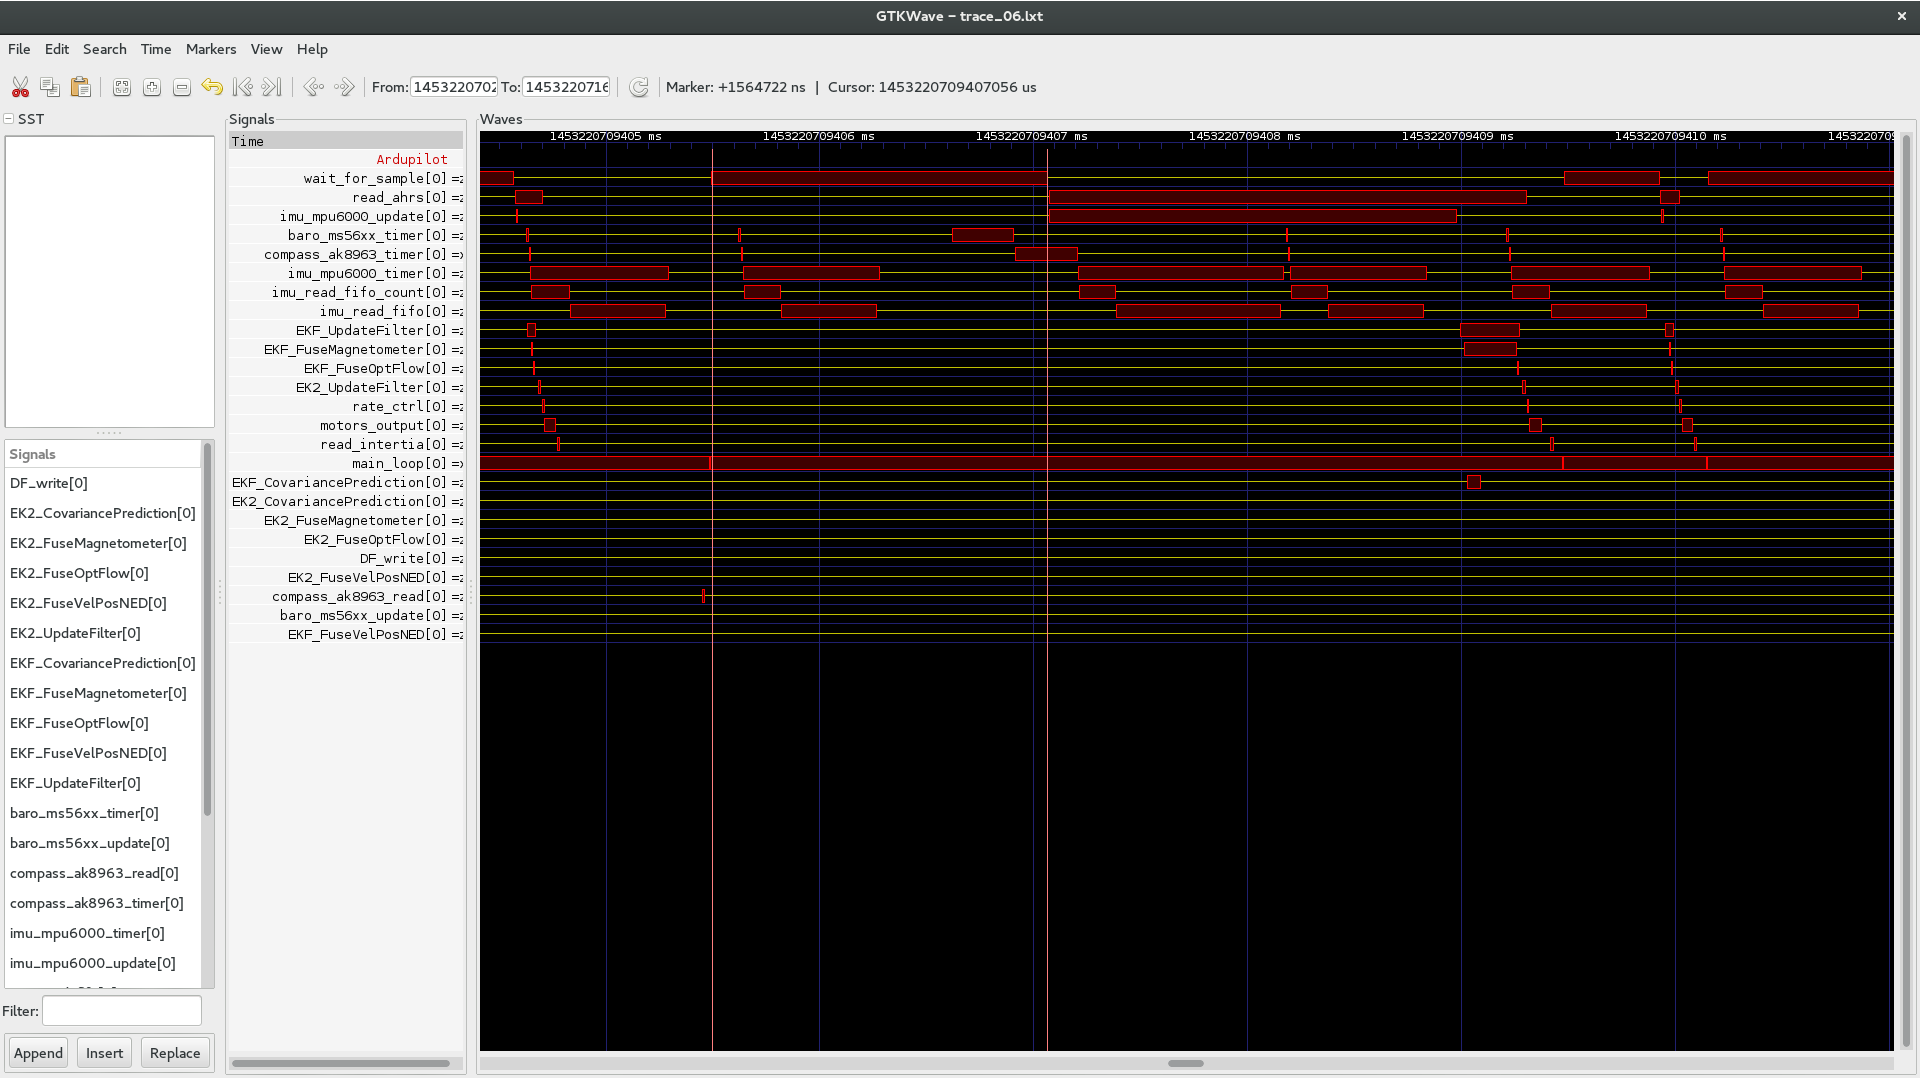
You can therefore measure the duration of an event with the cursors (use the mouse middle button to set the first cursor)