Using MAVExplorer for log analysis
MAVExplorer is a log exploration tool. It is based on the same concepts as mavgraph, but is interactive, and supports a community contribution model for pre-defined graphs.
Installing MAVExplorer on Linux
You will need the latest version of pymavlink and mavproxy installed. On Linux do this:
..code-block:: bash
sudo apt-get install python3-matplotlib python3-serial python3-wxgtk3.0 python3-lxml sudo apt-get install python3-scipy python3-opencv python3-pip python3-pexpect python3-tk sudo pip install –upgrade pymavlink mavproxy
after running that you should have a new command “MAVExplorer.py” in your path.
Installing MAVExplorer on Windows
To install MAVExplorer on Windows download the pre-built MAVProxy package here:
https://firmware.ardupilot.org/Tools/MAVProxy/
That package includes both MAVProxy and MAVExplorer.
Then create a link from
c:\Program Files (x86)\MAVProxy\MAVExplorer.exe
onto your desktop. You can then start MAVExplorer by dragging a log file onto the MAVExplorer shortcut.
Installing MAVExplorer on MacOS
To install MAVExplorer on MacOS you will need to have “pip” installed. If you don’t have pip, then use:
sudo easy_install pip
Then install mavproxy (which contains MAVExplorer) like this:
pip install mavproxy --user
Then add $HOME/Library/Python/2.7/bin to your $PATH, like this:
echo 'export PATH=$PATH:$HOME/Library/Python/2.7/bin' >> $HOME/.bash_profile
Starting MAVExplorer
To start MAVExplorer just run it with a filename as an argument. It will also start without a filename, and log file loaded later via the MAVExplorer menu’s “Open” item:
MAVExplorer.py ~/Desktop/ardupilot/00000013.bin
it supports MAVLink telemetry logs, or DataFlash Logs. After starting it you will end up with two windows, like this:
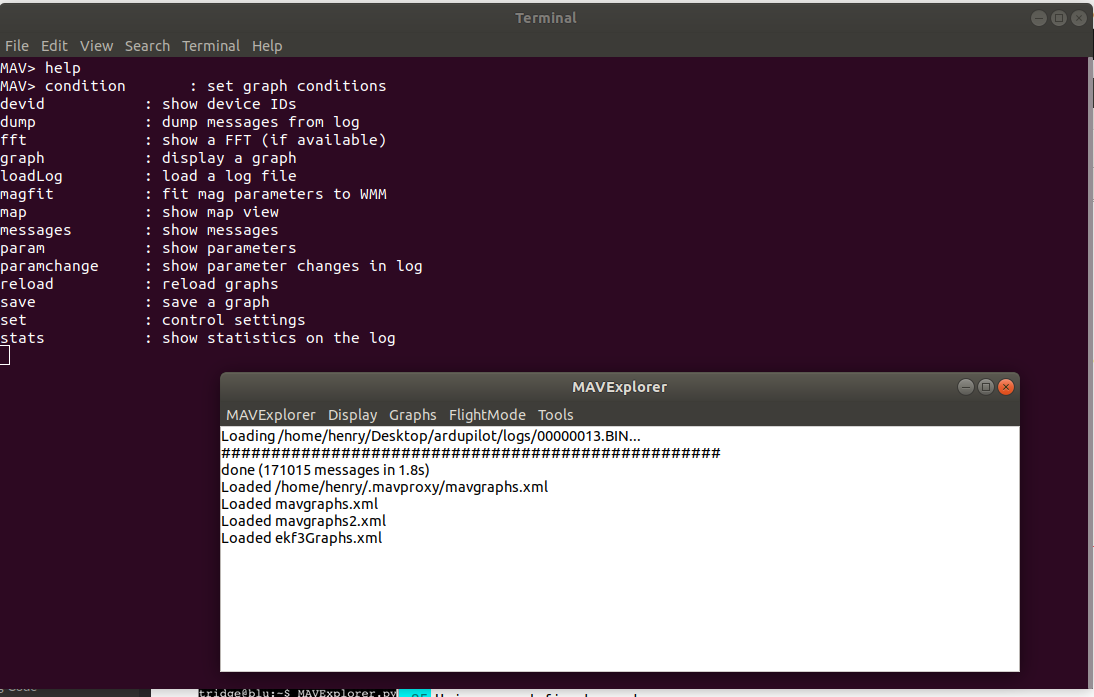
The bottom window is the “console” and has your menus and the status messages. The top window is your terminal, and has the “MAV>” prompt for typing commands. The result of typing “help” is shown listing the commands.
Note
be careful with spaces in log filenames. Use quotes around the filename if needed.
Using pre-defined graphs
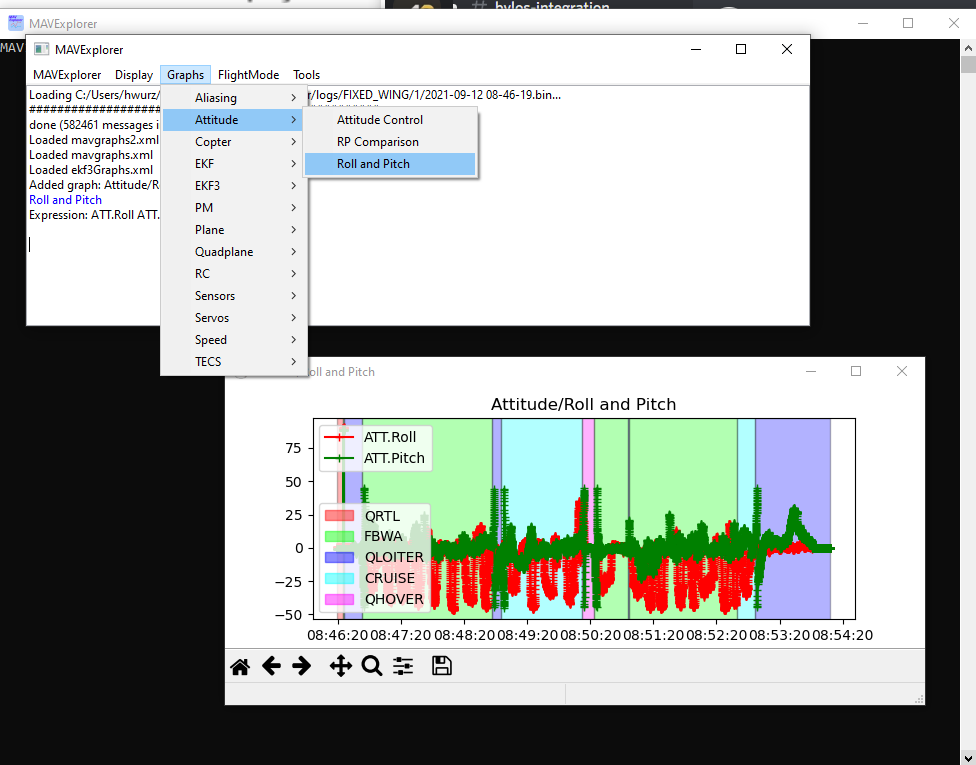
MAVExplorer comes with an extensive set of pre-defined graphs. Those graphs appear in the Graphs menu in the console. Only graphs that are relevant for the log you are viewing will appear in the menus.
To display a graph just choose it in the Graphs menu. You can display several graphs at once if you want to.
Graphing Manually
You can also graph any data from the log using the graph command in the terminal at the MAV> prompt. Just type graph followed by the expression. For example:
graph ATT.Roll ATT.Pitch
to help you create graphs quickly you can use the TAB key to complete and list available messages and fields. For example, if you did this:
graph <TAB><TAB>
you would see something like this:
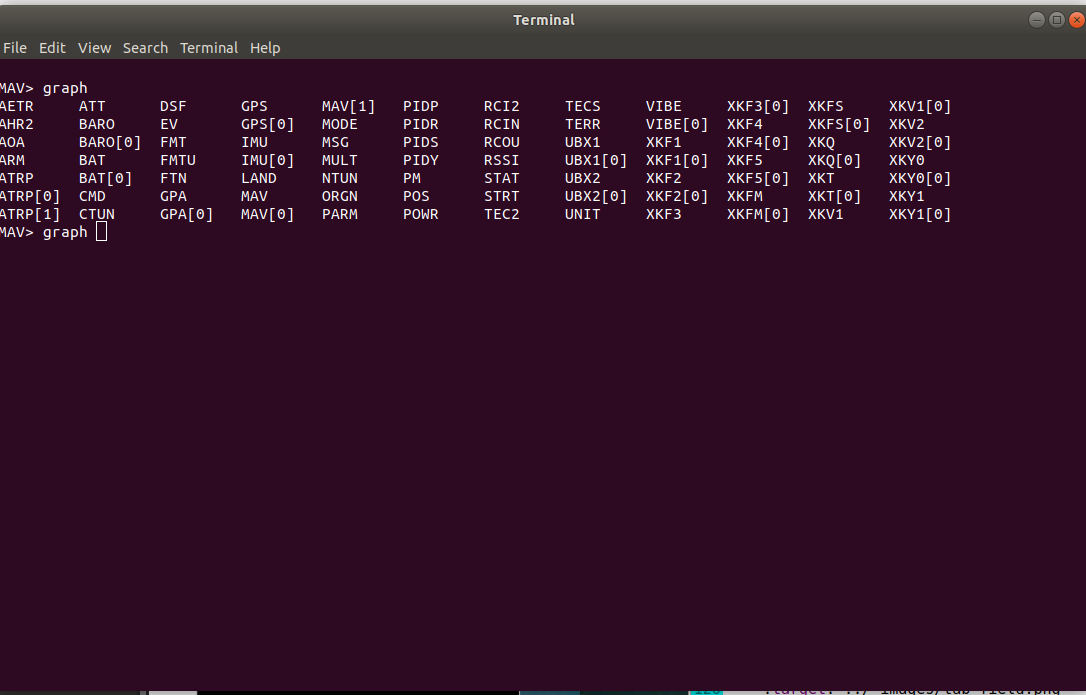
the list of possible message names has been listed. If you type part of the message name you want then you can use <TAB> to complete the name.
After the message name you need to type a ‘.’ followed by a field name. Again you can TAB complete, for example:
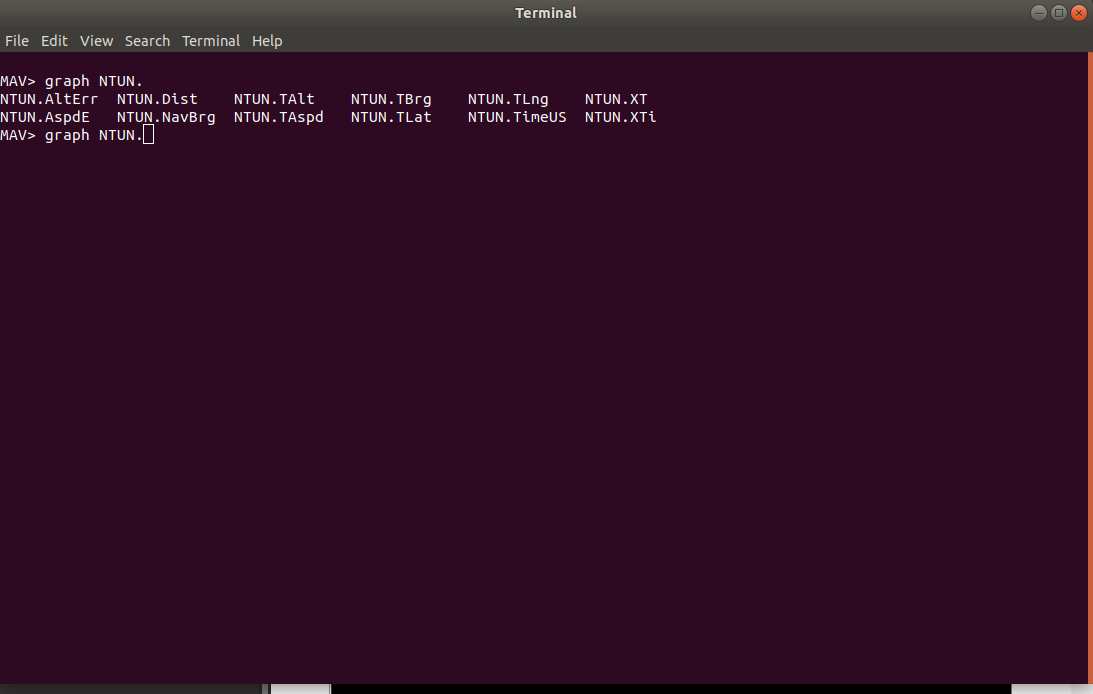
You can do this for multiple fields in one graph, allowing you to construct complex graphs quickly.
Some messages have Instance fields, for storing data of multiple instances of sensors, e.g. the RFND log message. In such cases, an instance number must be specified while graphing, else values from all the instances will be combined in a single graph.
graph RFND[0].Dist
Modifying pre-defined graphs
Whenever you use a pre-defined graph the graph expression gets added to your command line history. So you can just hit enter to refresh the history then up arrow to bring up the graph expression of the pre-defined graph you just displayed. You can then add new fields or editing existing fields and hit enter to display the new graph.
You can also save any graph you have just displayed using the “Save Graph” menu item under the “Display” menu:
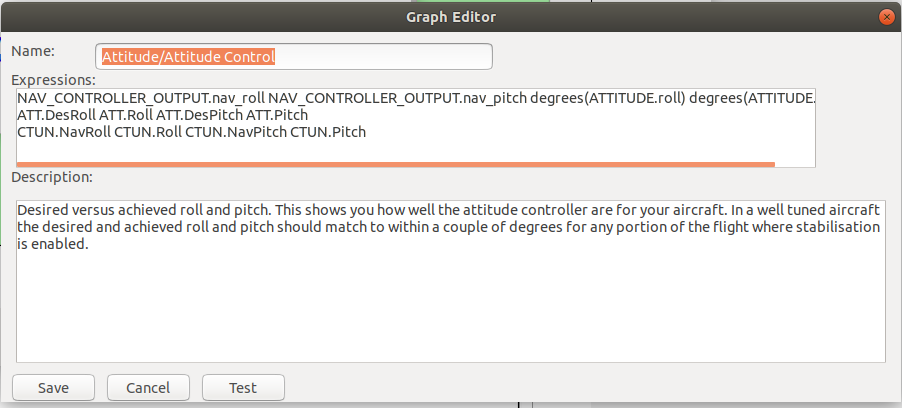
You can edit the name and description of the graph then press “Save” and your graph will be added to your set of pre-defined graphs. You can also use the “Test” button to test a graph before saving.
Note that the / separators in the name of the graph control how the graph will appear in the Graphs menu tree. So for example if you save a graph with a name of “Copter/Analysis/WPNav Analysis” then a “WPNav Analysis” menu item will be added to the Copter->Analysis submenu, automatically creating the submenus as needed.
Also note that each graph expression should be on a line by itself. If you have multiple lines for the expressions then they will be considered as alternative expressions (to cope with different types of logs).
Graph Expressions
Graph expressions are arbitrary python expressions. You can use any functions from the python maths library, plus any functions from the mavextra module in pymavlink or your own mavextra module.
This allows you to easily graph mathematical expressions combining any variables in the log. For example:
graph sqrt(MAG.MagX**2+MAG.MagY**2+MAG.MagZ**2)
that will graph the total magnetic field strength (the length of the compass vector).
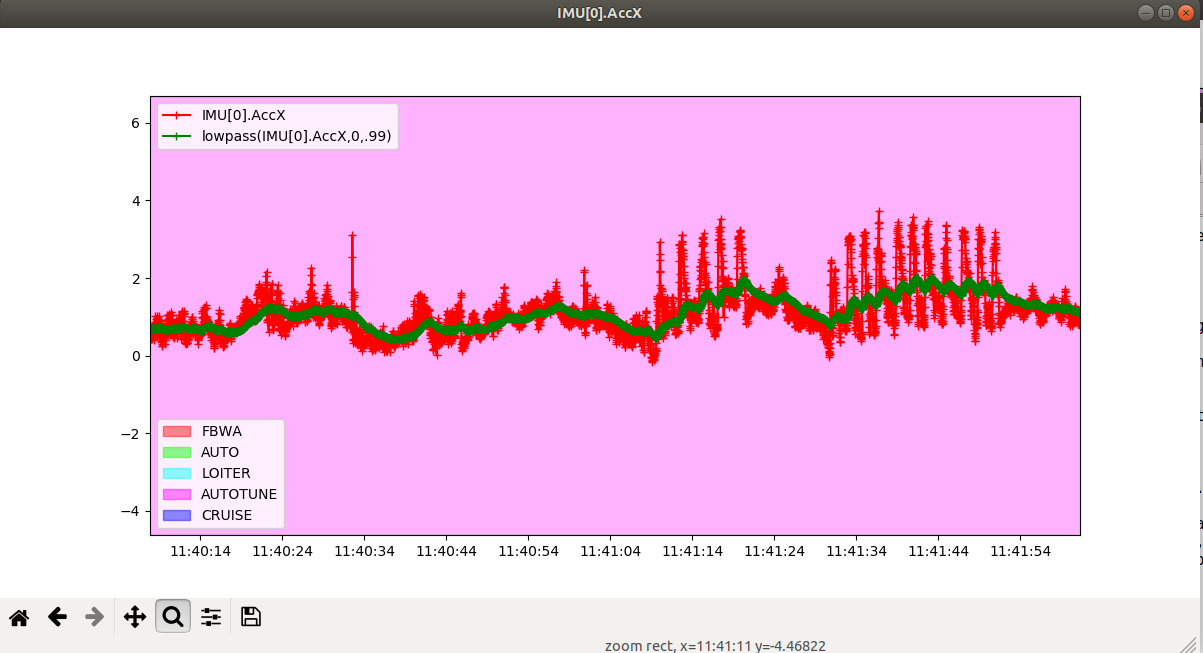
Another very useful express is a low pass filter on the data:
graph IMU[0].AccX lowpass(IMU[0].AccX,0,.99)
syntax is lowpass(variable to filter,tag,alpha) where “tag” is an arbitrary reference number, and “alpha” is weighting of current filter output, 1-alpha is the weighting of the present variable’s value this sample, and these are summed to provide the next filter output sample.
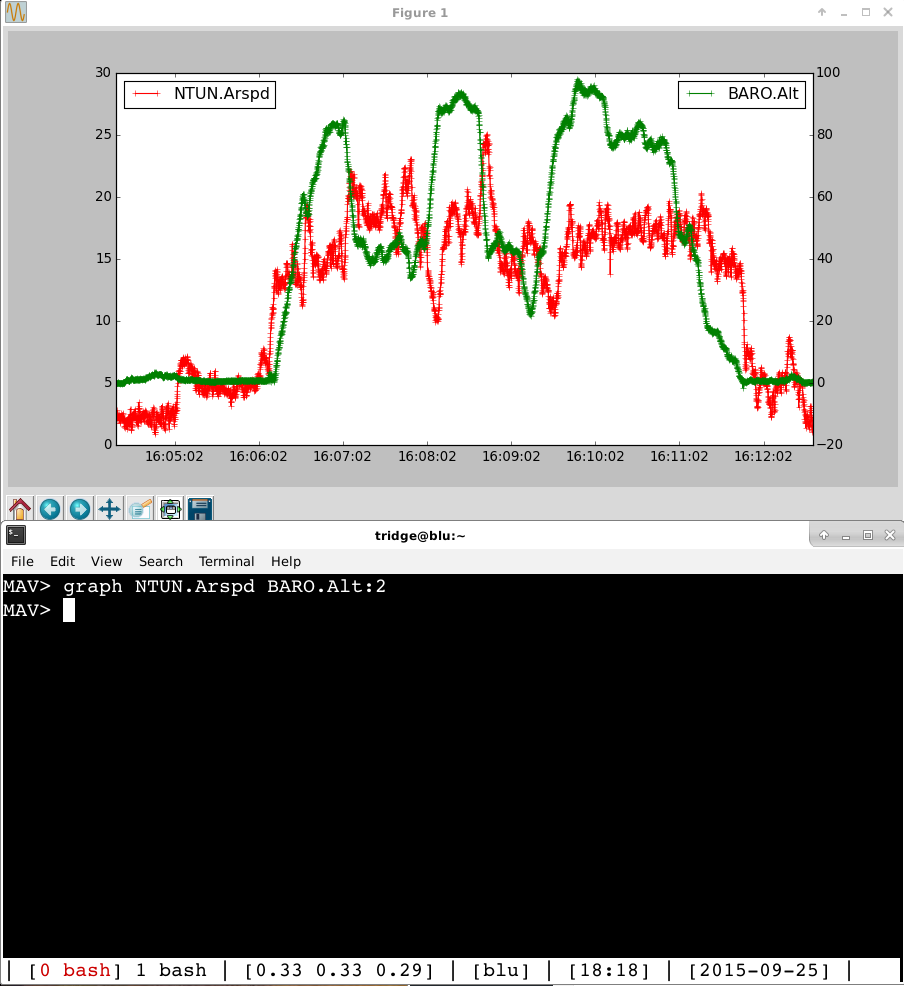
Right and Left scales
The default is that graphed values are shown on the left hand axis scale, all scaled together. To plane a field on the right hand scale just use “:2” on the end of the field name. For example:
Selecting by Flight Mode
It is often useful to select only a part of a flight based on the flight mode. To do that use the FlightMode menu:
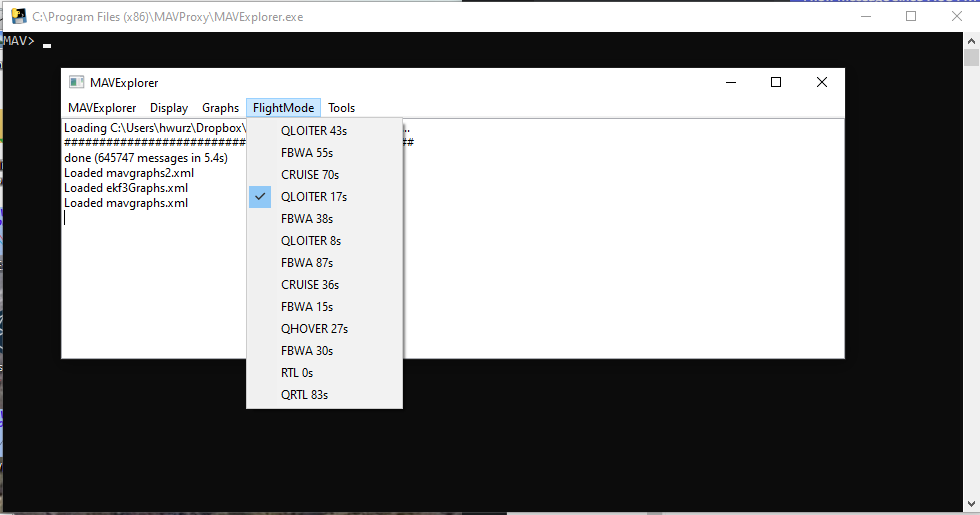
The FlightMode menu will show all the flight mode changes in your flight, along with how many seconds it was in that mode. You can select which parts of the flight to include in subsequent graphs by selecting the appropriate flight menu items. If none are selected then the whole log is graphed.
Adding Conditions
You can restrict graphs based on conditions expressed as python expressions of the available log variables. For example, if you wanted to only graph where the GPS speed was above 4 meters/second in a DataFlash log you could do this:
condition GPS.Spd>4
to clear the condition set it to the empty string
condition ''
Displaying a Map
You can display a map showing your flight path using the map command:
map
or selecting the MAP menu item from the Display menu.
A map will pop up following the current condition, like this:
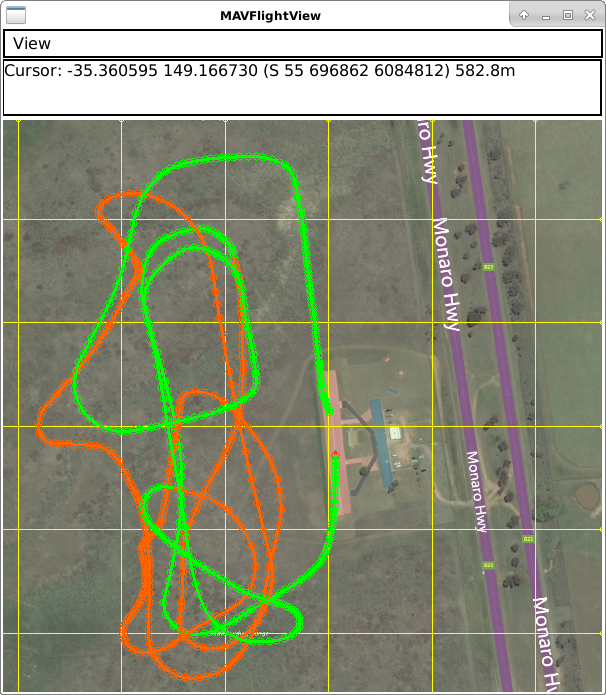
You can zoom in and out using the mouse and the scroll wheel or + and - keys. You can measure distances using two left clicks. Colours are used to indicate flight modes.
You can optionally supply message types to use for the map. Any message type that has latitude and longitude elements can be used. For example, to show a map from both the GPS and POS messages in an ArduPilot log file you can do:
map GPS POS
The multiple tracks will be shown with sequentially darker colours.
Graph Definition XML files
You will probably find it useful to add your own pre-defined graph definitions for commonly used graphs. These pre-defined graphs are created in XML files, and can be shared with other users of MAVExplorer.
The quickest way to create these graphs is to use the “Save Graph” feature, but you can also create the XML files manually using your favourite text editor.
You can see an example of the XML format here:
https://raw.githubusercontent.com/ArduPilot/MAVProxy/master/MAVProxy/tools/graphs/mavgraphs.xml
Create an XML graph file
MAVExplorer looks in 3 places for XML files to get graph definitions from:
in the current directory it looks for a file called “mavgraphs.xml”
in your home directory it looks for any XML files in your $HOME/.mavproxy/ directory (note the ‘.’ in front of mavproxy).
In the MAVExplorer package there is a mavgraphs.xml file included (it is the one linked above)
For your own graphs you can use a file called $HOME/.mavproxy/mygraphs.xml and put this into it to start with:
<graphs>
 <graph name='Test/Test Graph'>
 <description>My Test Roll</description>
 <expression>degrees(ATTITUDE.roll)</expression>
 <expression>ATT.Roll</expression>
 </graph>
</graphs>
A few key features of the XML file are:
you can have as many graphs as you like in a single XML file
Each graph has a name which should be unique
The ‘/’ separators in the name determine where the graph appears in the menu structure
Each graph should have a text description
Each graph can have multiple expression. The first expression that is applicable to the current log is used in producing the graph.
because there are multiple expressions for a graph you can create one graph definition that works for both telemetry logs and dataflash logs, and works for copter, plane and rover. It also allows us to add new expressions to cope with changing field names as ArduPilot evolves.
Reloading the graphs
When editing XML files to add graphs you don’t need to exit and restart MAVExplorer to try out your new graphs. Just run the command “reload” or use the “Reload Graphs” menu item and your new graphs will be loaded into the menus.
Contributing Graphs
One of the main reasons for the XML files in MAVExplorer is to allow community members to contribute new graphs that are useful in log analysis. If you create a set of useful graphs please send them by email to andrew-mavexplorer@tridgell.net or open a pull request against the MAVProxy git repository.
For a pull request with graphs, please add the graphs to the MAVProxy/tools/graphs directory
Useful Commands
param <regular expression> : displays parameters from log, eg. to show TECS params: “param TECS_*” or “param” to show all
paramchange <regular expression>: displays changes of parameter(s) throughout the log
messages: displays GCS messages
dump <log message>: dumps all instances of that log message, eg. “dump IMU”